
R language: English Premier League Soccer Standings
INTRODUCTION
The English Premier League (EPL) is a major soccer league in Great Britain consisting of 20 teams. The season begins in August and concludes in May with each team playing each other team exactly twice (home and away). Each team plays 38 games in a season while the total number of games is 380. A team receives 3 points for a win and if the game is tied, both teams receive 1 point; no points are awarded for a loss.
This is an individual project to develop a function with the inputs of date and season that returns the league standings for the date ad season specified (e.g. ‘04/25/2018’, ‘2017/18’).
The data sets were found here under the heading Premier League.
You can find the full project description and the code here.
FUNCTIONS AND CODE COMMENTS
Data Preparation
Load the libraries and create a list of the links to load the full data sets directly from the website:
library(tidyverse)
library(lubridate)
library(dplyr)
library(scales)

links = list(
  "2019/20" = "http://www.football-data.co.uk/mmz4281/1920/E0.csv",
  "2018/19" = "http://www.football-data.co.uk/mmz4281/1819/E0.csv",
  "2017/18" = "http://www.football-data.co.uk/mmz4281/1718/E0.csv"
)
Create a function to load the desired dataset that indicates the data type of each needed columns. Read the dataset from the link list based on the season input with the date in ‘dmy’ form. Check on not null dates. Keep the records having happened before the date input (within the season input only).
load_data <- function(date = NULL, season) {
  col_types = cols(
    HomeTeam = col_character(),
    AwayTeam = col_character(),
    FTHG = col_integer(),
    FTAG = col_integer(),
    FTR = col_character()
  )
  df <- read_csv(url(links[[season]]), col_types = col_types) %>%
      select(Date, HomeTeam, AwayTeam, FTHG, FTAG, FTR) %>%
      mutate(Date = dmy(Date))
    if (!is.null(date)) {
      return(df %>% filter(Date <= mdy(date)))
    }
    return(df)
  }
Data Processing
Requirement: The function should accomplish two goals. It should
-
return a data frame shown below

-
display the standings in descending order according to the number of points per match earned up to and including the date parameter value. When two teams have the same number of points per match, the teams should appear in descending order according to the number of points per match, then wins, then goals scored per match and finally ascending according to goals allowed per match.
Step-by-step
Create a separate function for Streak with ‘data’ as a parameter - the source for calculation and output delivery
summarize_streak <- function(data) { #The column "Status" (created later) will be used to call this function
  print(data)
  n <- length(data)
  count <- 1 #Star counting from 1
  value <- data[n] #Current value
  try({
#This is a backwards for loop, meaning it will loop through the most recent to the least recent records
    for (i in 0 : (n - 2)) {
      if (data[n - i] != data[n - i - 1]) { #n-i is the last record in the dataset, n-i-1 is the right above record
        break                               #If the two consecutive values are not the same -> break adn return 1 for count
      }
      count <- count + 1 #Calculate how many in sequence are the same. Keep counting until the 2 consecutive values do not match
    }
  })

  return(str_c(value, count))#Combine the results for streak
}
Create another separate function for records of the last 10 games played by each team
summarize_record <- function(W, L, D, n = 10) { #n=10 since we wanted to get 10 records
  tailW <- tail(W, n) #tail function is used to get the most recent records
  tailL <- tail(L, n)
  tailD <- tail(D, n)
  return(paste(sum(tailW), sum(tailL), sum(tailD), sep ="-"))
}
Create a main function to deliver all the columns required
EPL_Standings <- function(date, season) {
  full_data = load_data(date, season)

  #Use Pivot_longer to combine any columns ending with 'Team' (HomeTeam, AwayTeam) into a new column named 'TeamName'
  #Then create the colum 'Role' to indicate if the team played as a home team (H) or away team (A)
  #Names_prefix is to remove matching text from the start of each varible name
  result <- full_data %>%
    pivot_longer(cols = ends_with("Team"), names_to = "Role", values_to = "TeamName", names_prefix = "*(ome|way)Team") %>%
    mutate(GS = if_else(Role == "H", FTHG, FTAG),
           GA = if_else(Role == "H", FTAG, FTHG),
  #Record for home team: wins-H_H, losses-A_H, ties-D_H. Return 1 for True and 0 for False
  #Same approach for away team
           H_H = if_else(FTR == "H" & Role == "H", 1L, 0L),
           H_A = if_else(FTR == "H" & Role == "A", 1L, 0L),
           A_H = if_else(FTR == "A" & Role == "H", 1L, 0L),
           A_A = if_else(FTR == "A" & Role == "A", 1L, 0L),
           D_H = if_else(FTR == "D" & Role == "H", 1L, 0L),
           D_A = if_else(FTR == "D" & Role == "A", 1L, 0L),
  #Sum the records to get the total wins-losses-ties for each team
  #For a team, wins(W) would be the total of FTR=H when it played as a hometeam and TFTR=A when as an awayteam
  #Same approach for losses(L) and ties (D)
           W = H_H + A_A,
           D = D_H + D_A,
           L = A_H + H_A,
           Status = if_else(W == 1, "W", if_else(D == 1, "D", "L"))) %>% #Create the column 'Status' for the Streak calculation
    group_by(TeamName) %>%
    arrange(Date) %>%
    summarize(Last10 = summarize_record(W, L, D), #Call both of the separate functions for last10 and streak
              Streak = summarize_streak(Status),
              GS = sum(GS), #Sum function is used to get the total record for each unique team
              GA = sum(GA),
              H_H = sum(H_H),
              H_A = sum(H_A),
              A_H = sum(A_H),
              A_A = sum(A_A),
              D_H = sum(D_H),
              D_A = sum(D_A),
              W = sum(W),
              D = sum(D),
              L = sum(L)) %>%
    mutate(Record = paste(W, L, D, sep ="-"), #Combine values with the separator "-"
           HomeRec = paste(H_H, A_H, D_H, sep ="-"), #As explained above
           AwayRec = paste(A_A, H_A, D_A, sep ="-"),
           MatchesPlayed = W + D + L,
           Points = W * 3 + D,
           PPM = Points / MatchesPlayed,
           PtPct = percent(Points / (3 * MatchesPlayed)),
           GSM = GS / MatchesPlayed,
           GAM = GA / MatchesPlayed) %>%
    arrange(desc(PPM), desc(W), desc(GSM), GAM)

  output <- result %>% select(TeamName, Record, HomeRec, AwayRec, MatchesPlayed, Points, PPM, PtPct, GS, GSM, GA, GAM, Last10, Streak)
  return(output)
}
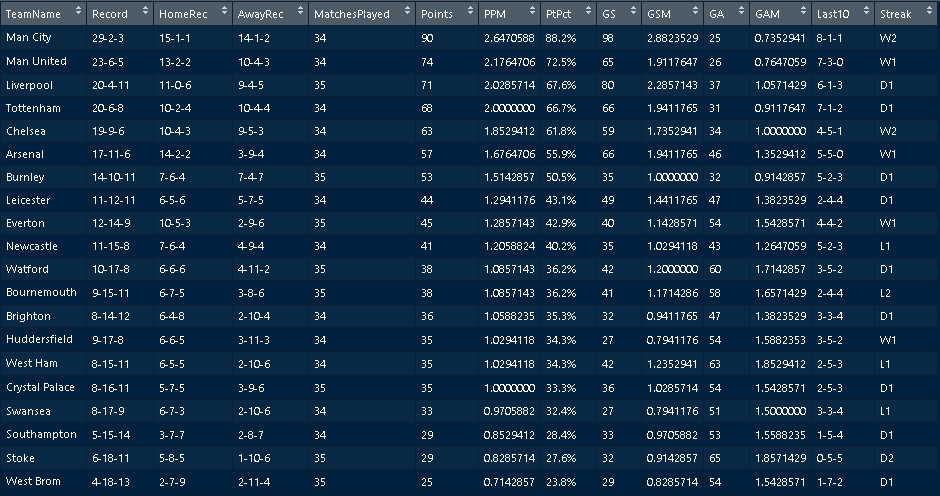
Finally, let’s test it out and see the results!!!
standings <- EPL_Standings('04/25/2018', '2017/18')
OUTPUT