

Machine Learning: Prediction of The Sale Price of A Toyota
INTRODUCTION
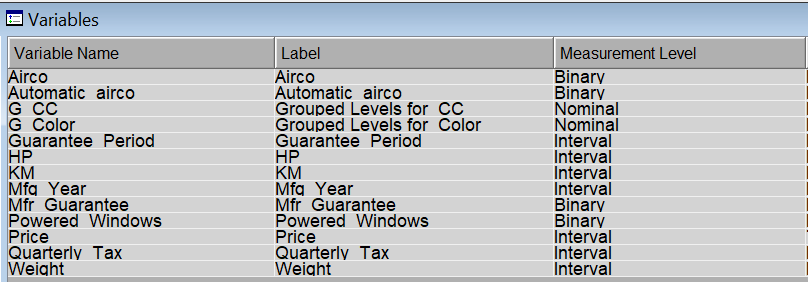
This data mining project is to predict the sale price of the Toyota Corolla brand cars based on different predictors:
The project was ran in the SAS Enterprise Miner software using two different methods such as Decision Tree and Neural Network to output the optimal predictive model that includes the most important variables for sale price prediction.
You can find the full data set here
DECISION TREE METHOD
DATA PROCESSING AND FINDINGS
THE FLOW DIAGRAM & DESCRIPTION
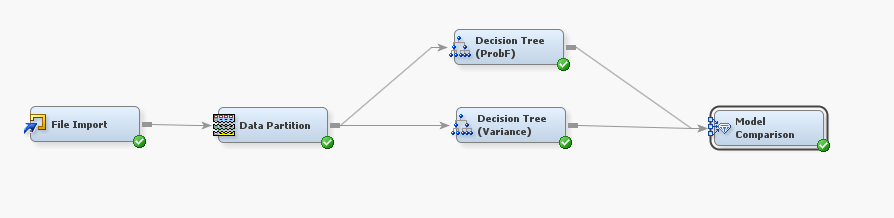
In the diagram, the File Import node was used to import the file into SAS as it was an excel file. The Data Partition node was assigned with a breakdown of 60% train, 30% validation, 10% test. Then two decision tree models were ran to compare the simplicity and the fit of the models. Since the Price target was a continuous variable, there were two different splitting methods offered in SAS EM such as F-statistics and Variance. At the same time, Average Squared Error (ASE) was chosen to be the assessment measure for both of the models. Thus, for the first decision tree, F-statistic for splitting and Average Squared Error (ASE) as the assessment measure, and for the second decision tree, we used Variance for splitting and ASE as the assessment measure. Finally, the Model Comparison was used to examine the two model and select the better one.
Note: Decision Tree node was also used for variable selection step.
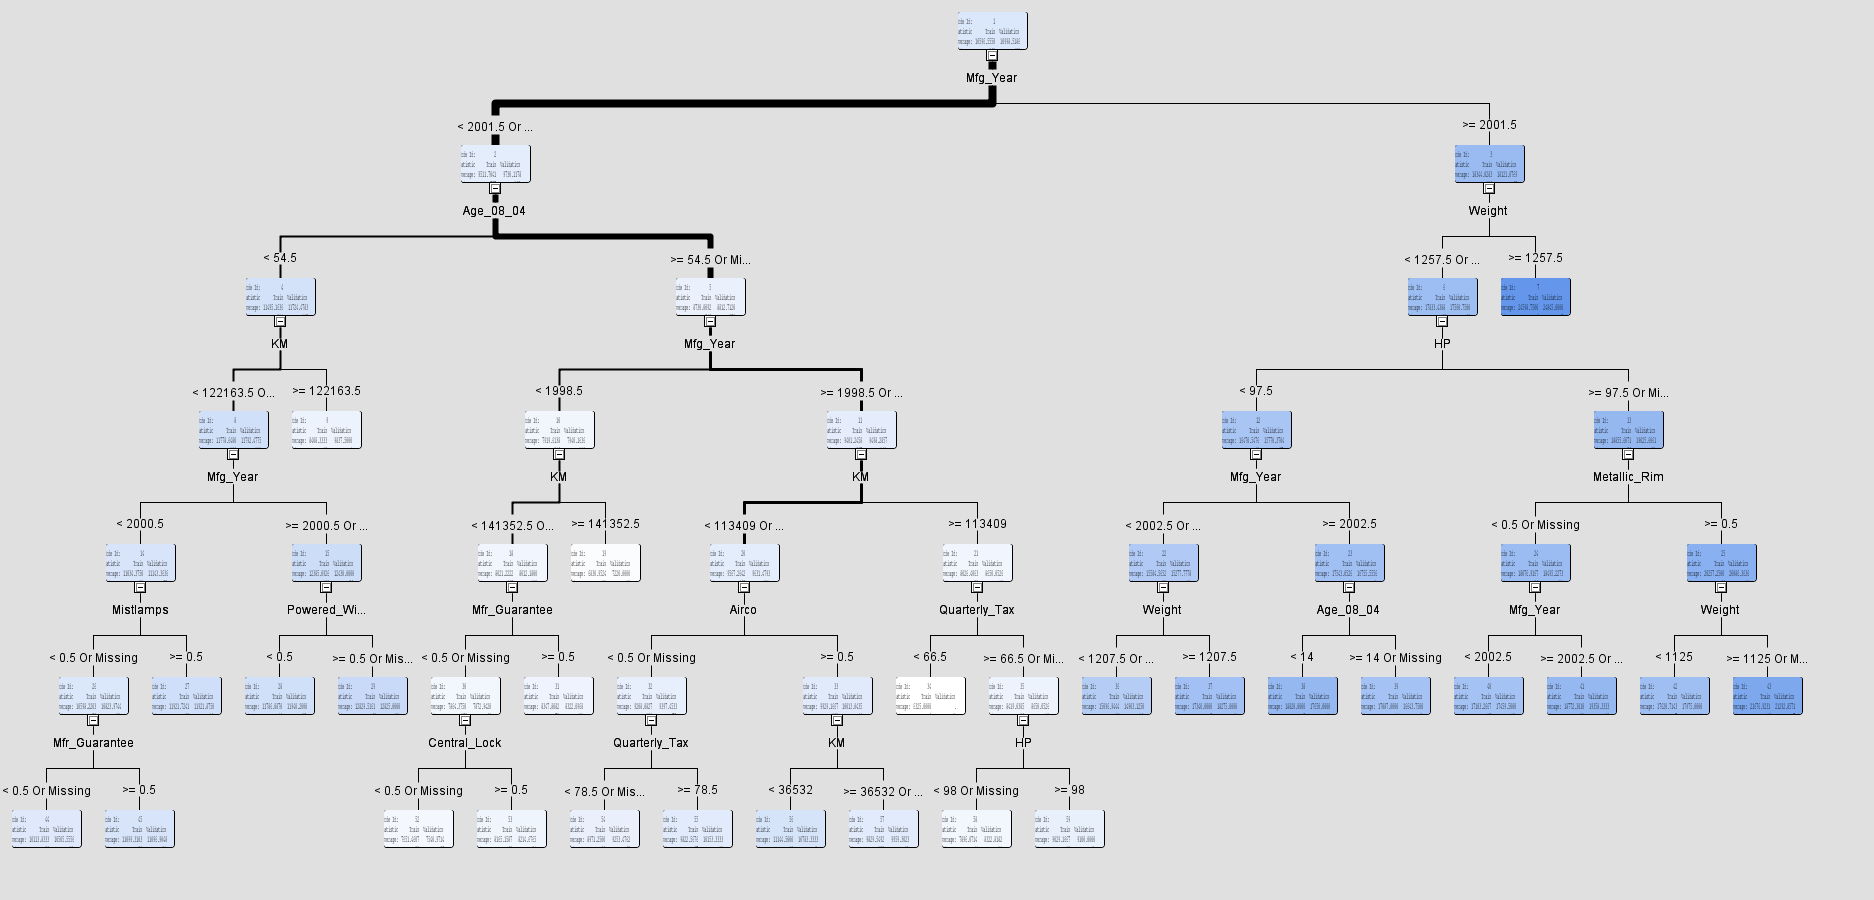
DECISION TREE USING F-STATISTICS (MODEL 1)
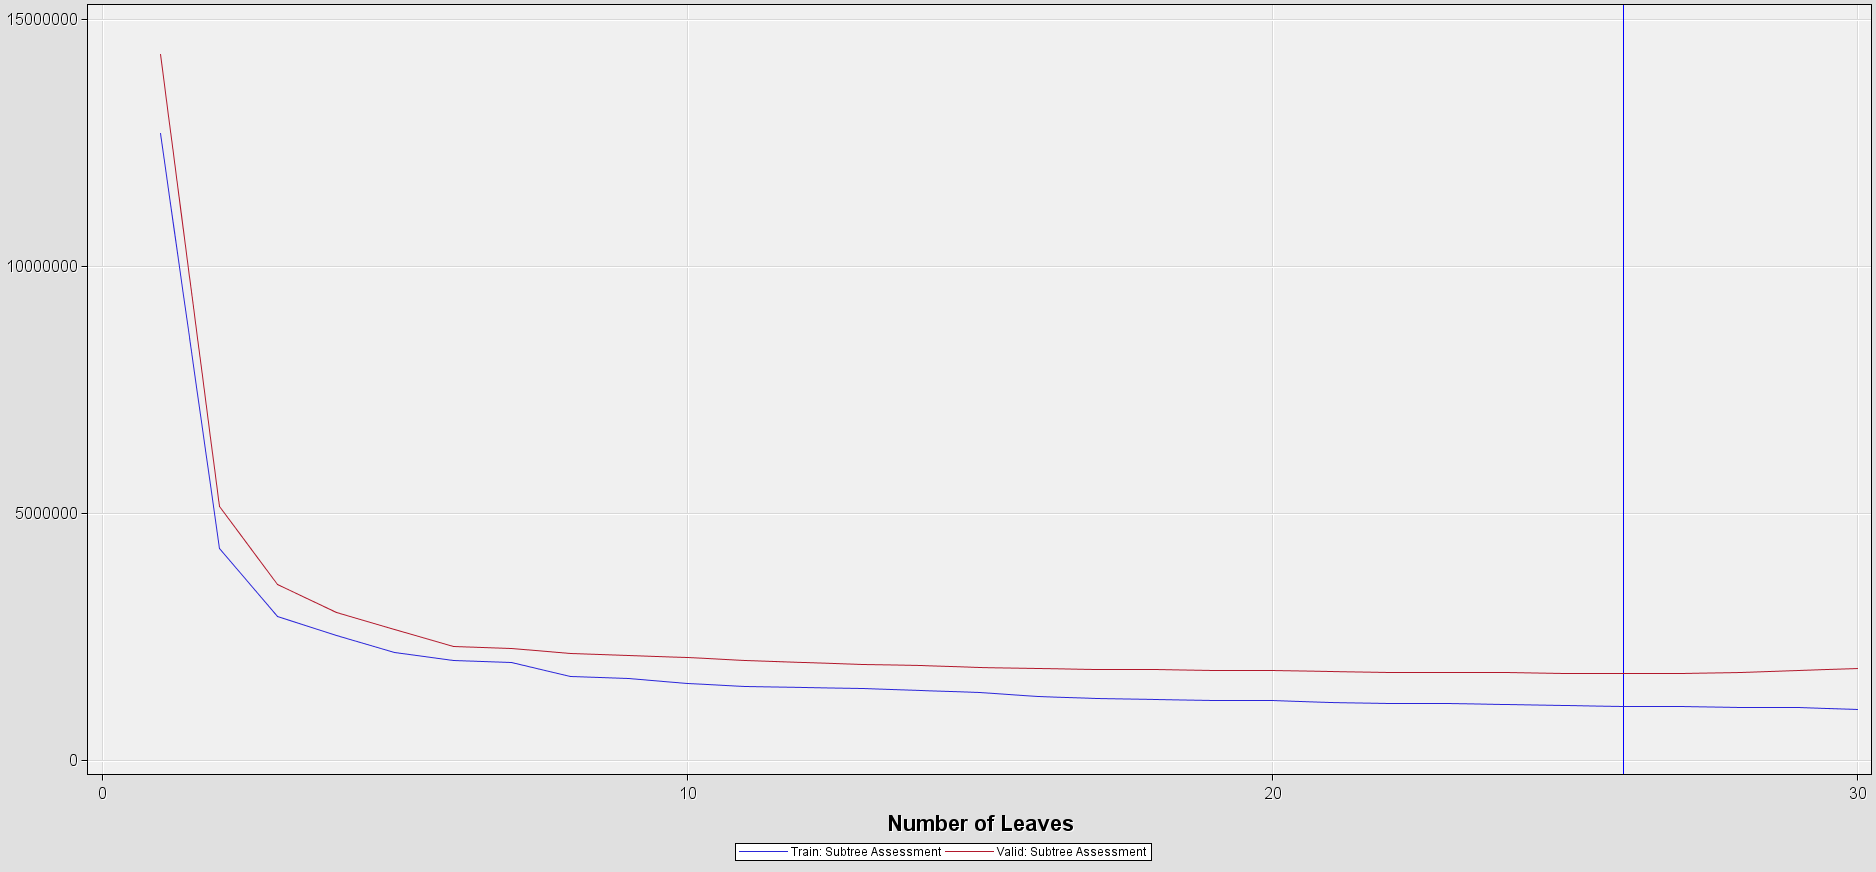
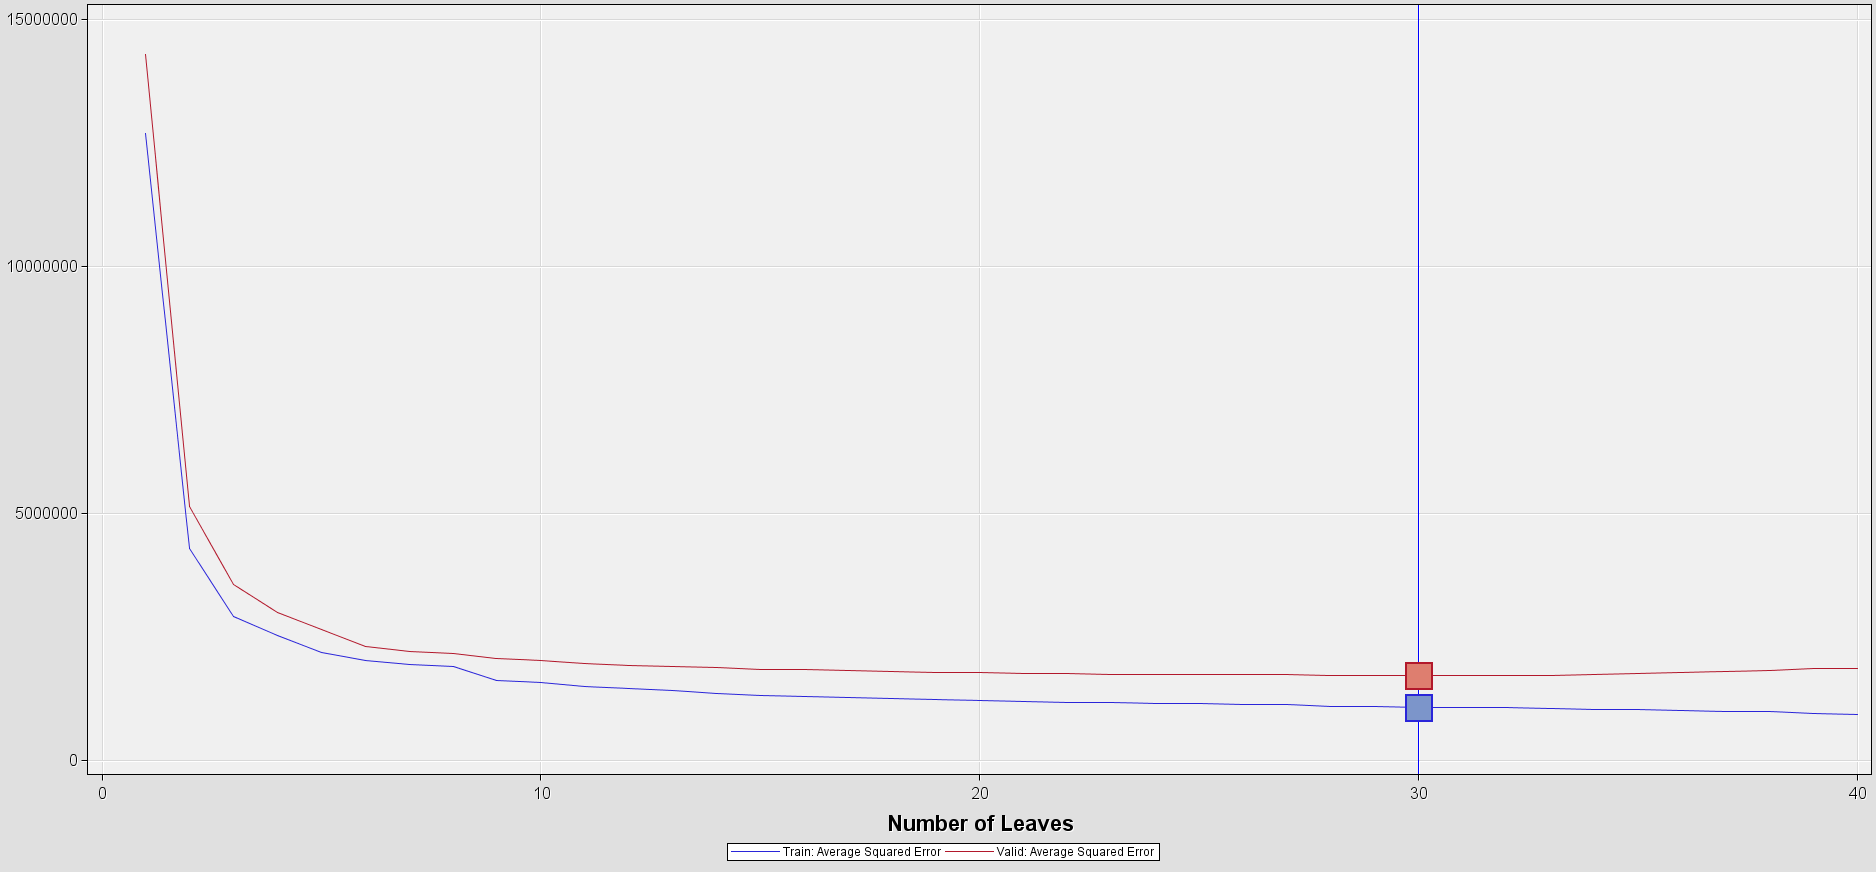
Subtree Assessment Plot
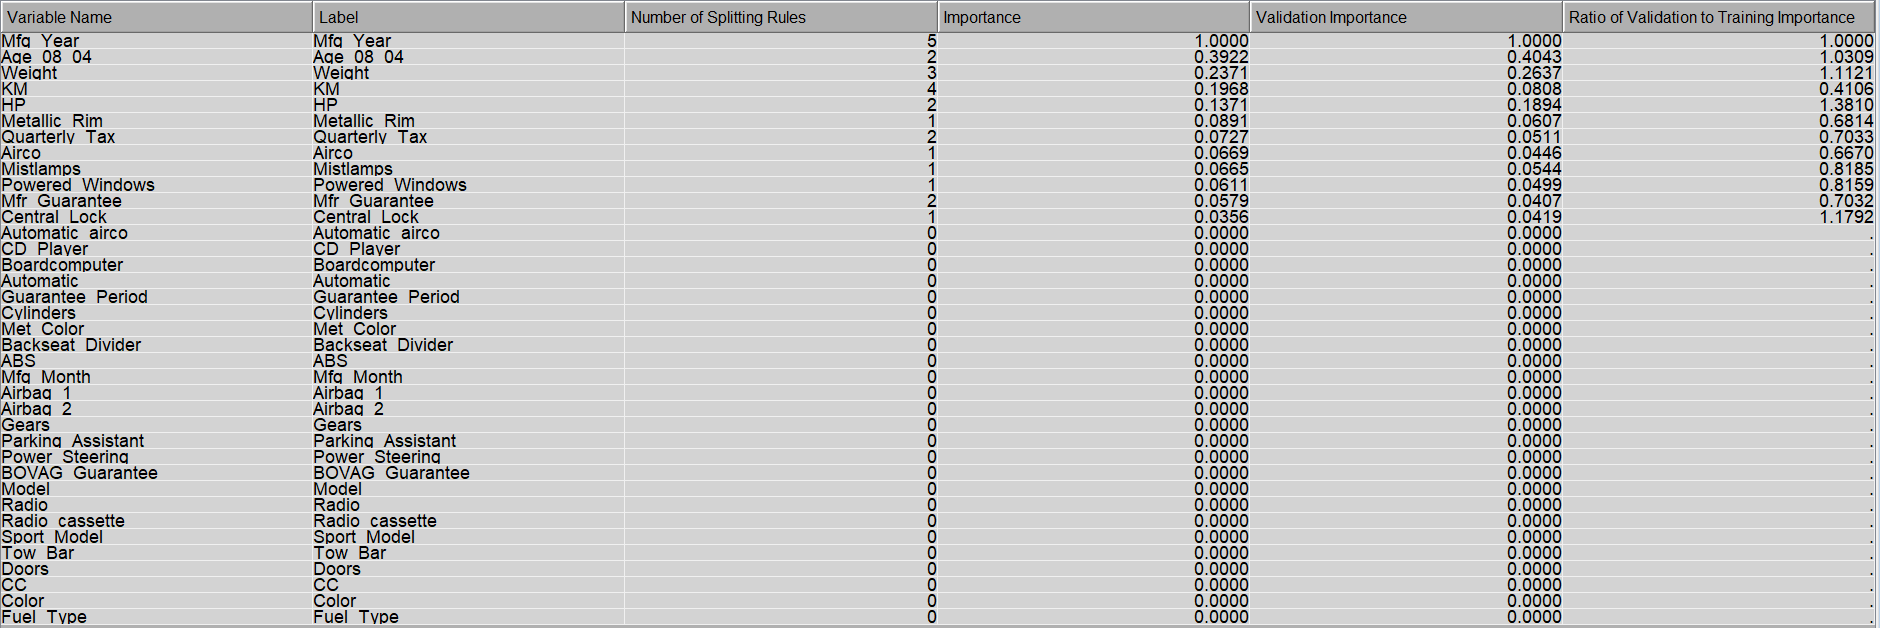
Variable Importance In Descending Order
DECISION TREE USING VARIANCE (MODEL 2)
Subtree Assessment Plot
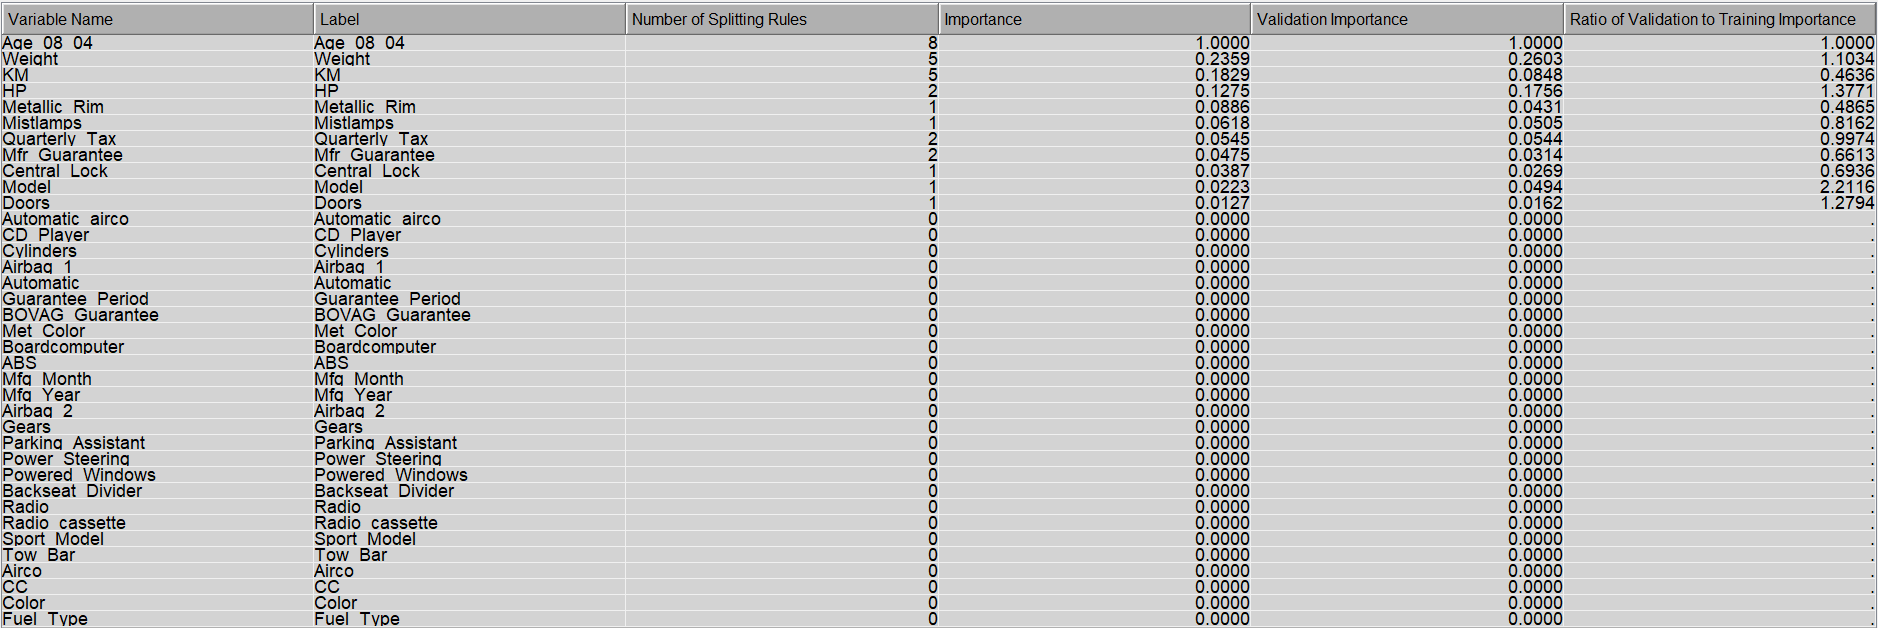
Variable Importance In Descending Order
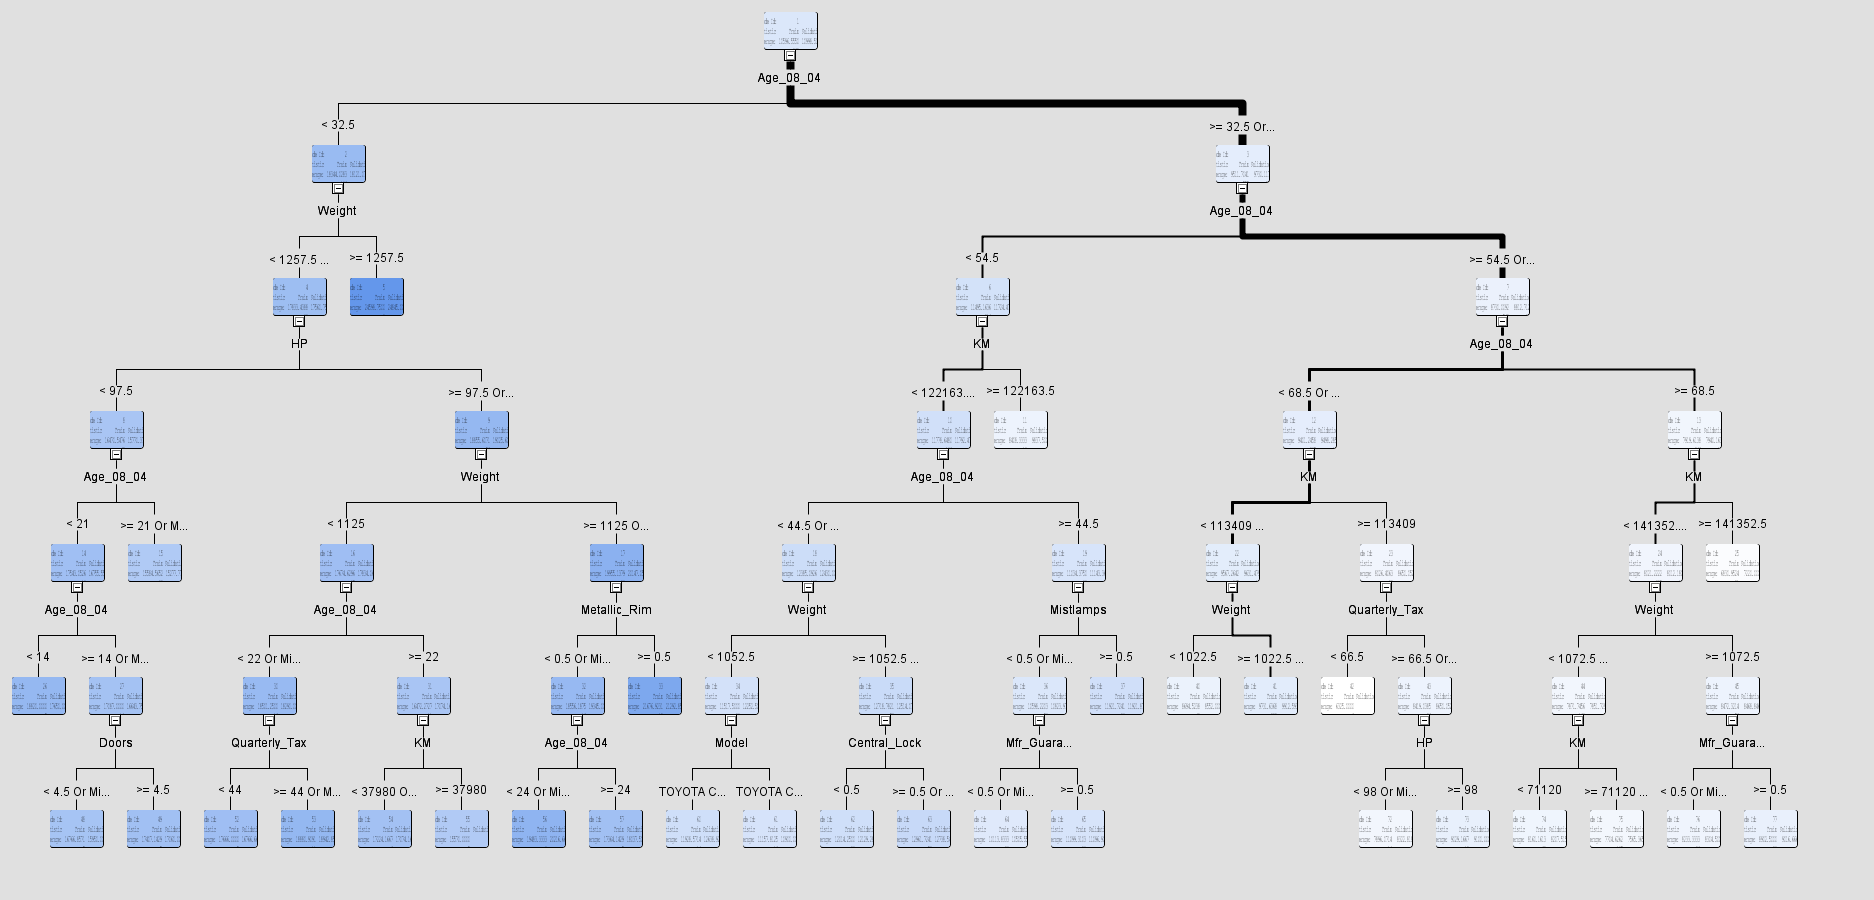
The decision tree in model 1 was pruned at the 26th leave node based on the cutoff value whereas the decision tree in model 2 has 30 leaves after pruning based on the best split to minimize the variance. The default settings were used for tree pruning in both of the models.
MODEL OUTPUTS AND FINDINGS
Score Rankings Overlay: Price
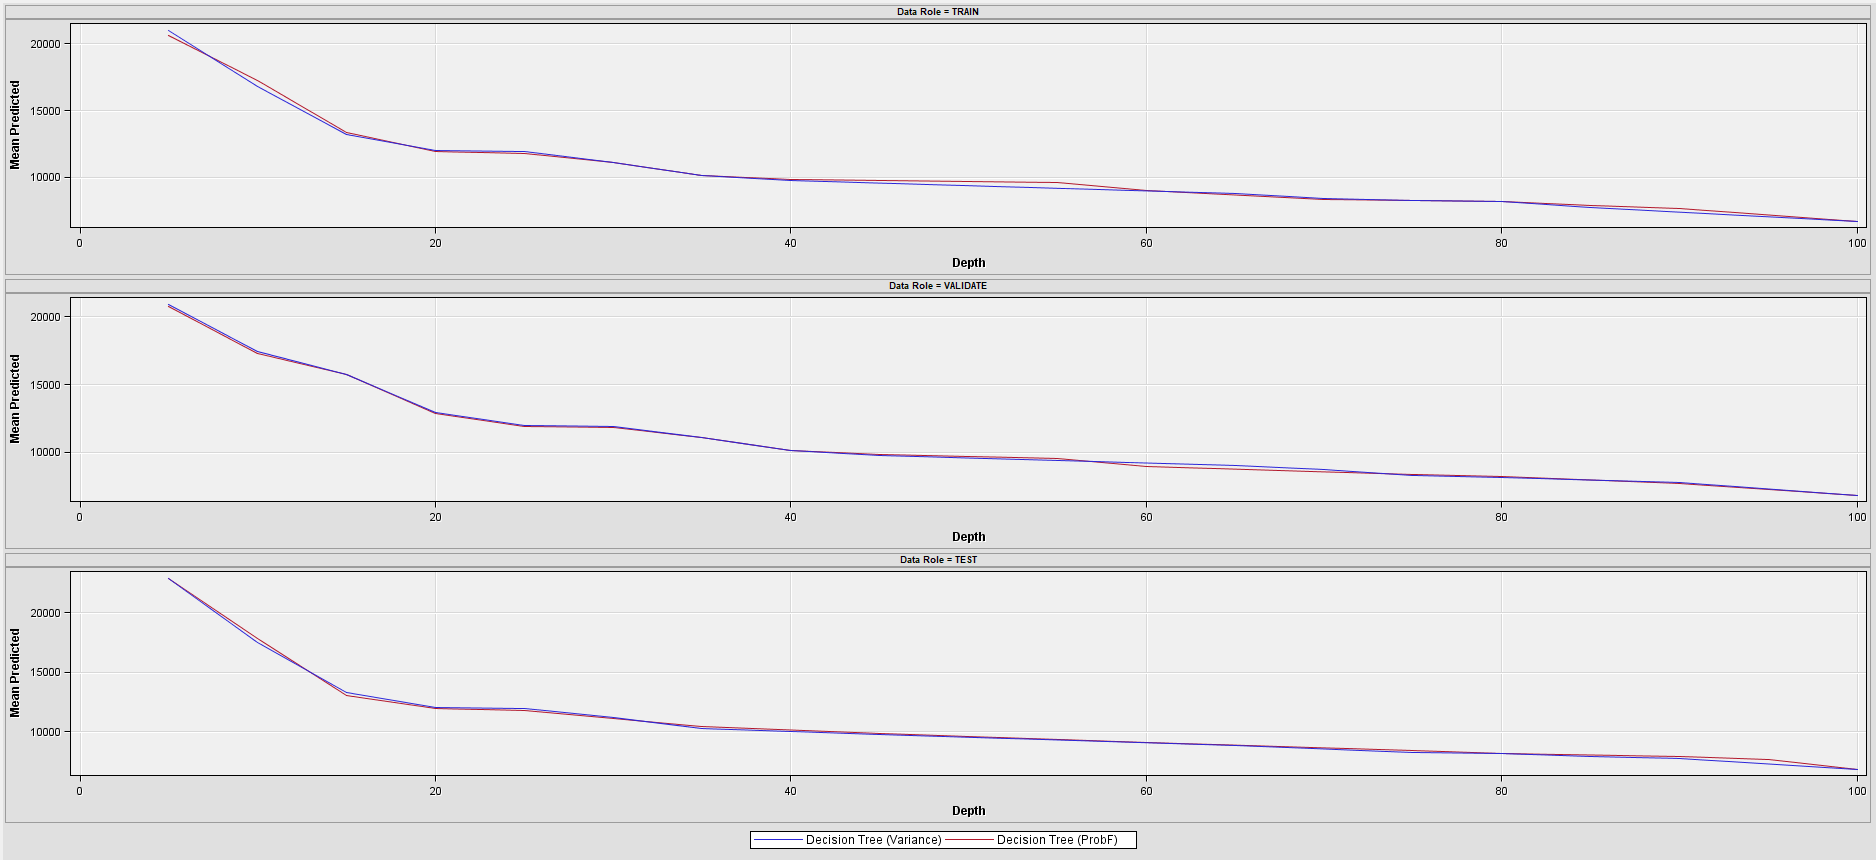
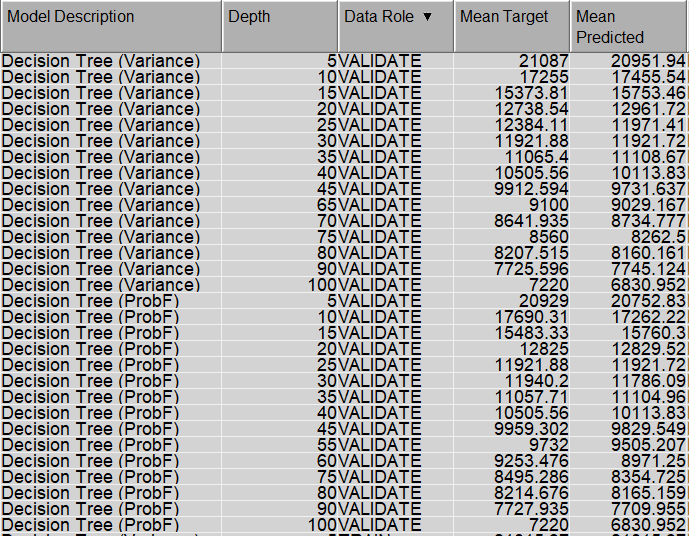
By looking at the score rankings overlay plot, the Mean Predicted curves of both of the models seem very close to each other, meaning that the differences of the predicted means between the models are minor.
Fit Statistics
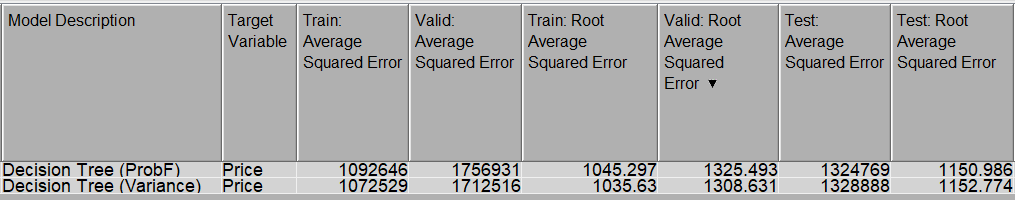
In order to choose the best model, it is always better and more clear to look at several metrics. Based on the Fit Statistics table, in terms of RMSE, the decision tree using Variance fitting method is better. It indicates the absolute fit of the model to the data, which is how close the observed data points are to the model’s predicted values. The RMSE is lower therefore produces a better fit in the Variance model.
NEURAL NETWORK METHOD
DATA PROCESSING AND FINDINGS
THE FLOW DIAGRAM & DESCRIPTION
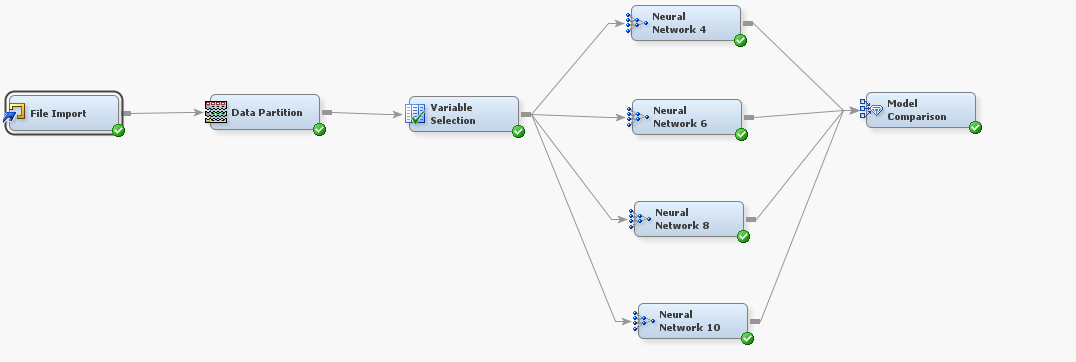
In the diagram, the File Import node was used to import the file into SAS as it was an excel file. The Data Partition node was assigned with a breakdown of 60% train, 30% validation, 10% test. Due to the fact that neural network is notorious in terms of its sensitivity to curse of dimensionality, the Variable Selection node was used to select the most important variables to the target Sales Price. Then four multilayer perceptron neural network models were run with different numbers of hidden layer units which were indicated by the number shown on each neural network node. Because of the problem of high dimensionality, the number of hidden units may have to increase, adding to the complexity of the initial model.
Variable Selection
NEURAL NETWORK ARCHITECTURE
The architecture of all the neural network nodes were set as Multilayer Perceptron. Therefore, SAS Enterprise Mine automatically used the default settings for the Hidden Layer Combination and Activation Functions. Because of the continuous target, Identity was set for Target Layer Activation Function and Normal for Target Layer Error Function.
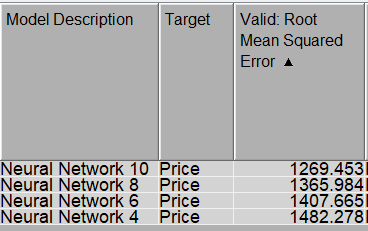
Next, Root Mean Squared Error (RMSE) was used as a metric to indicate the best model.
Iteration Plot
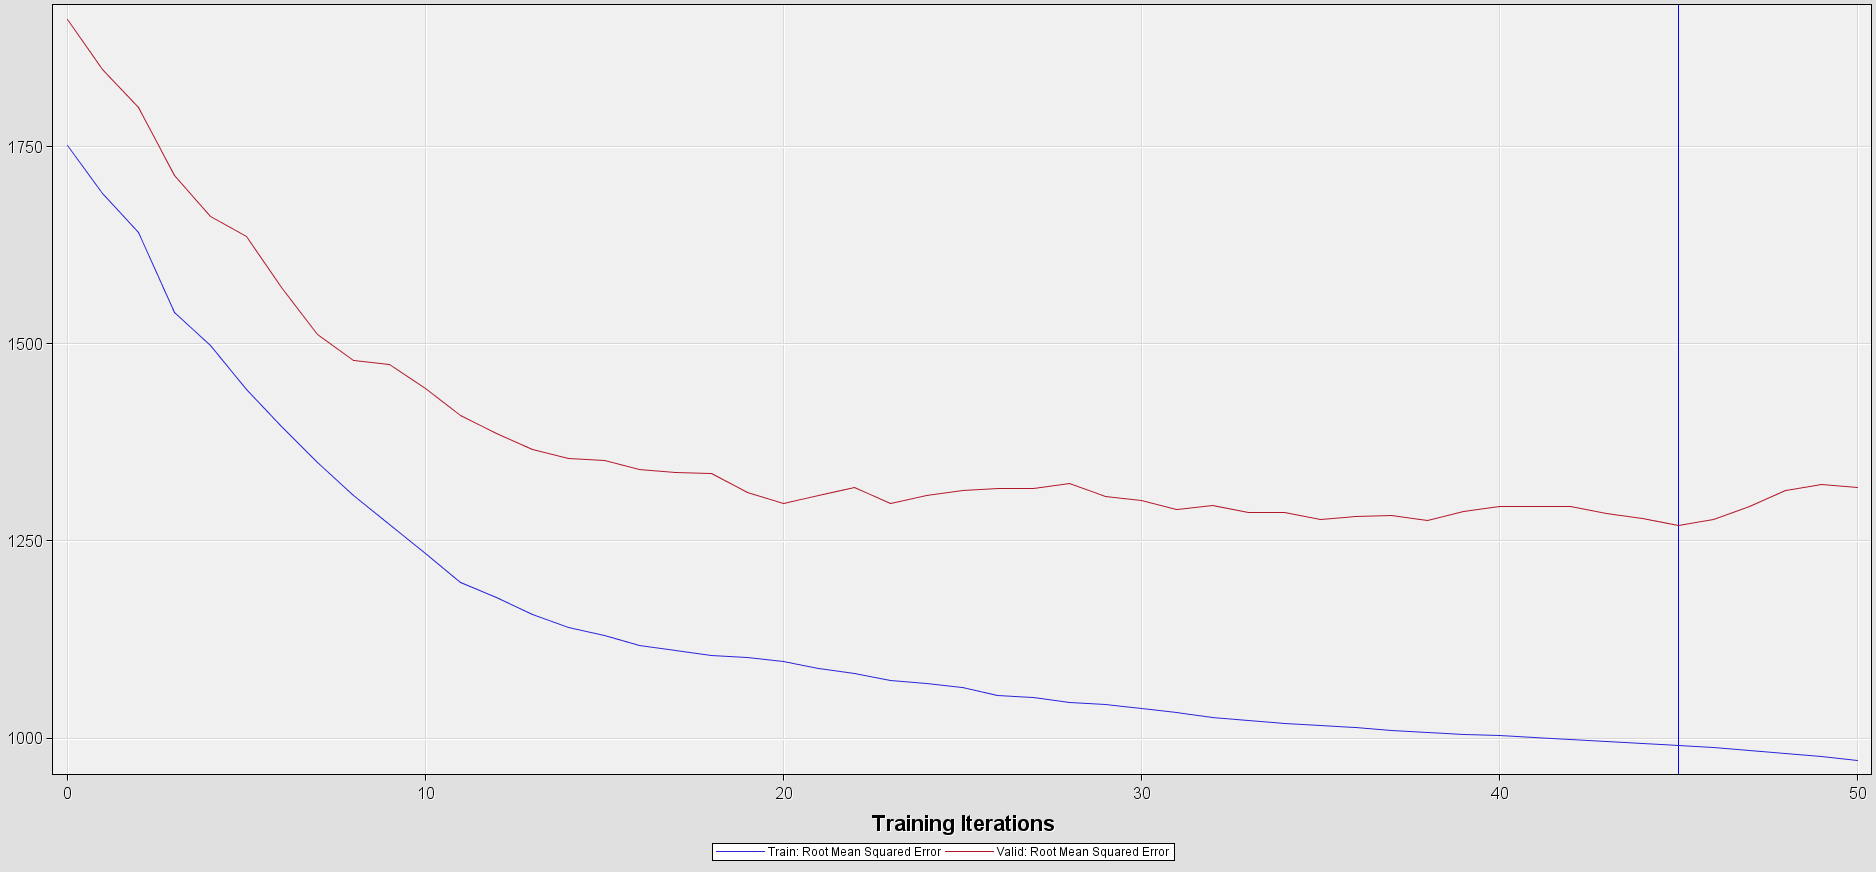
Based on the Valid RSME outputs from the Model Comparison Node (above), Neural Network 10 is the best model out of the 4 models. The best RMSE value (1269.4) falls at the iteration 45 in the Neural Network 10.
Mean Predicted
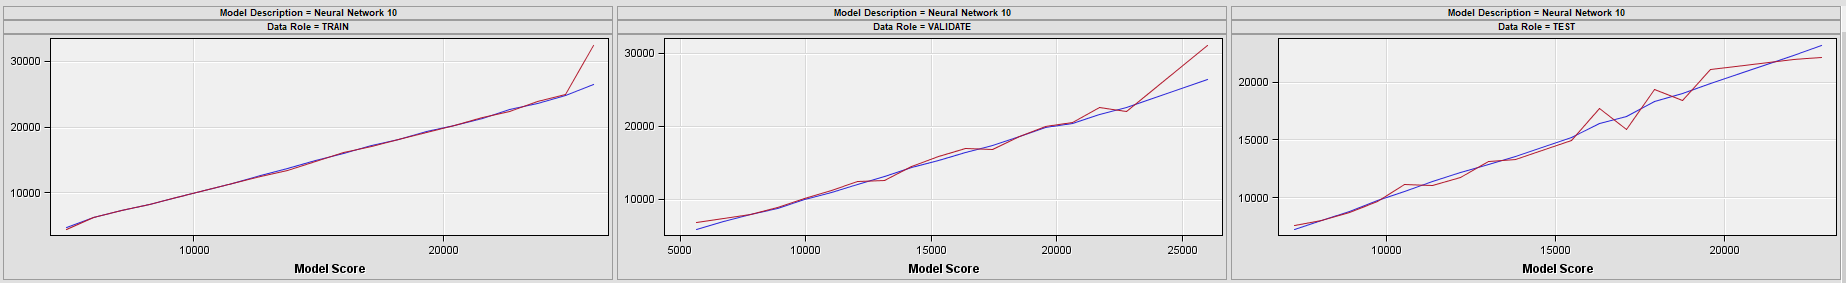
By looking at the score rankings overlay plot, the Mean Predicted and Mean Target curves associated with the Validation date of the model Neural Network 10 are very close to each other, meaning that the differences of the predicted mean price and the target mean price are minor, thus this is a good model.
In the Neural Network 10, there are 231 parameters!
OUTPUT COMPARISON BETWEEN DECISION TREE & NEURAL NETWORK MODELS
Validation Record Example
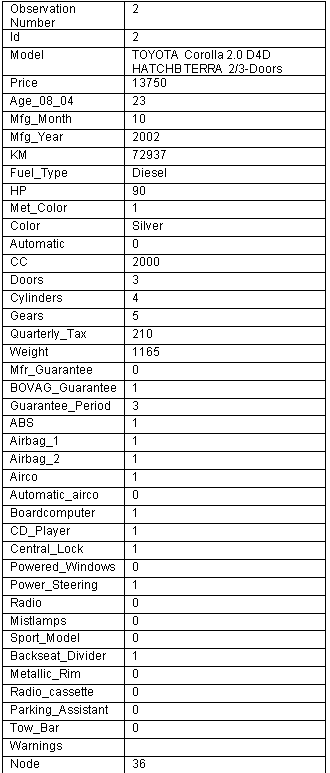
With the same record, the two decision trees above give different predicted prices. Based on the decision tree in model 1, the predicted price for the specific car model was $14,903 while the decision tree in model 2 predicted higher price, which was $15,277. Therefore once again, the Variance model is concluded to be the better model.
Regarding the Neural Network 10, for the same Validation record example above, the predicted car price is approximately $14,548 (provided by SAS EM).
As a result, the Variance model is the best model for the company to use to predict the car price.